Belgium: Hard Numbers | Flanders Solar Panel Market Outperforms Preliminary Data

This week, “The Hard Numbers” focuses on new data from the Flemish Energy and Climate Agency (VEKA) regarding the Flemish solar panel market. An important caveat is that figures for the most recent months are always provisional. For instance, in VEKA’s previous update, only 1,648 of the smallest solar panel installations were recorded for July 2026, compared to 3,347 in the latest data – more than a doubling. For August, 1,657 registrations are now on record: a figure that will undergo a similar upward correction in the coming months. Data for the first half of the calendar year has already been corrected multiple times. The picture there is more nuanced: newly registered capacity in the residential category fell by approximately 9 percent compared to the first half of 2025.
Monthly average
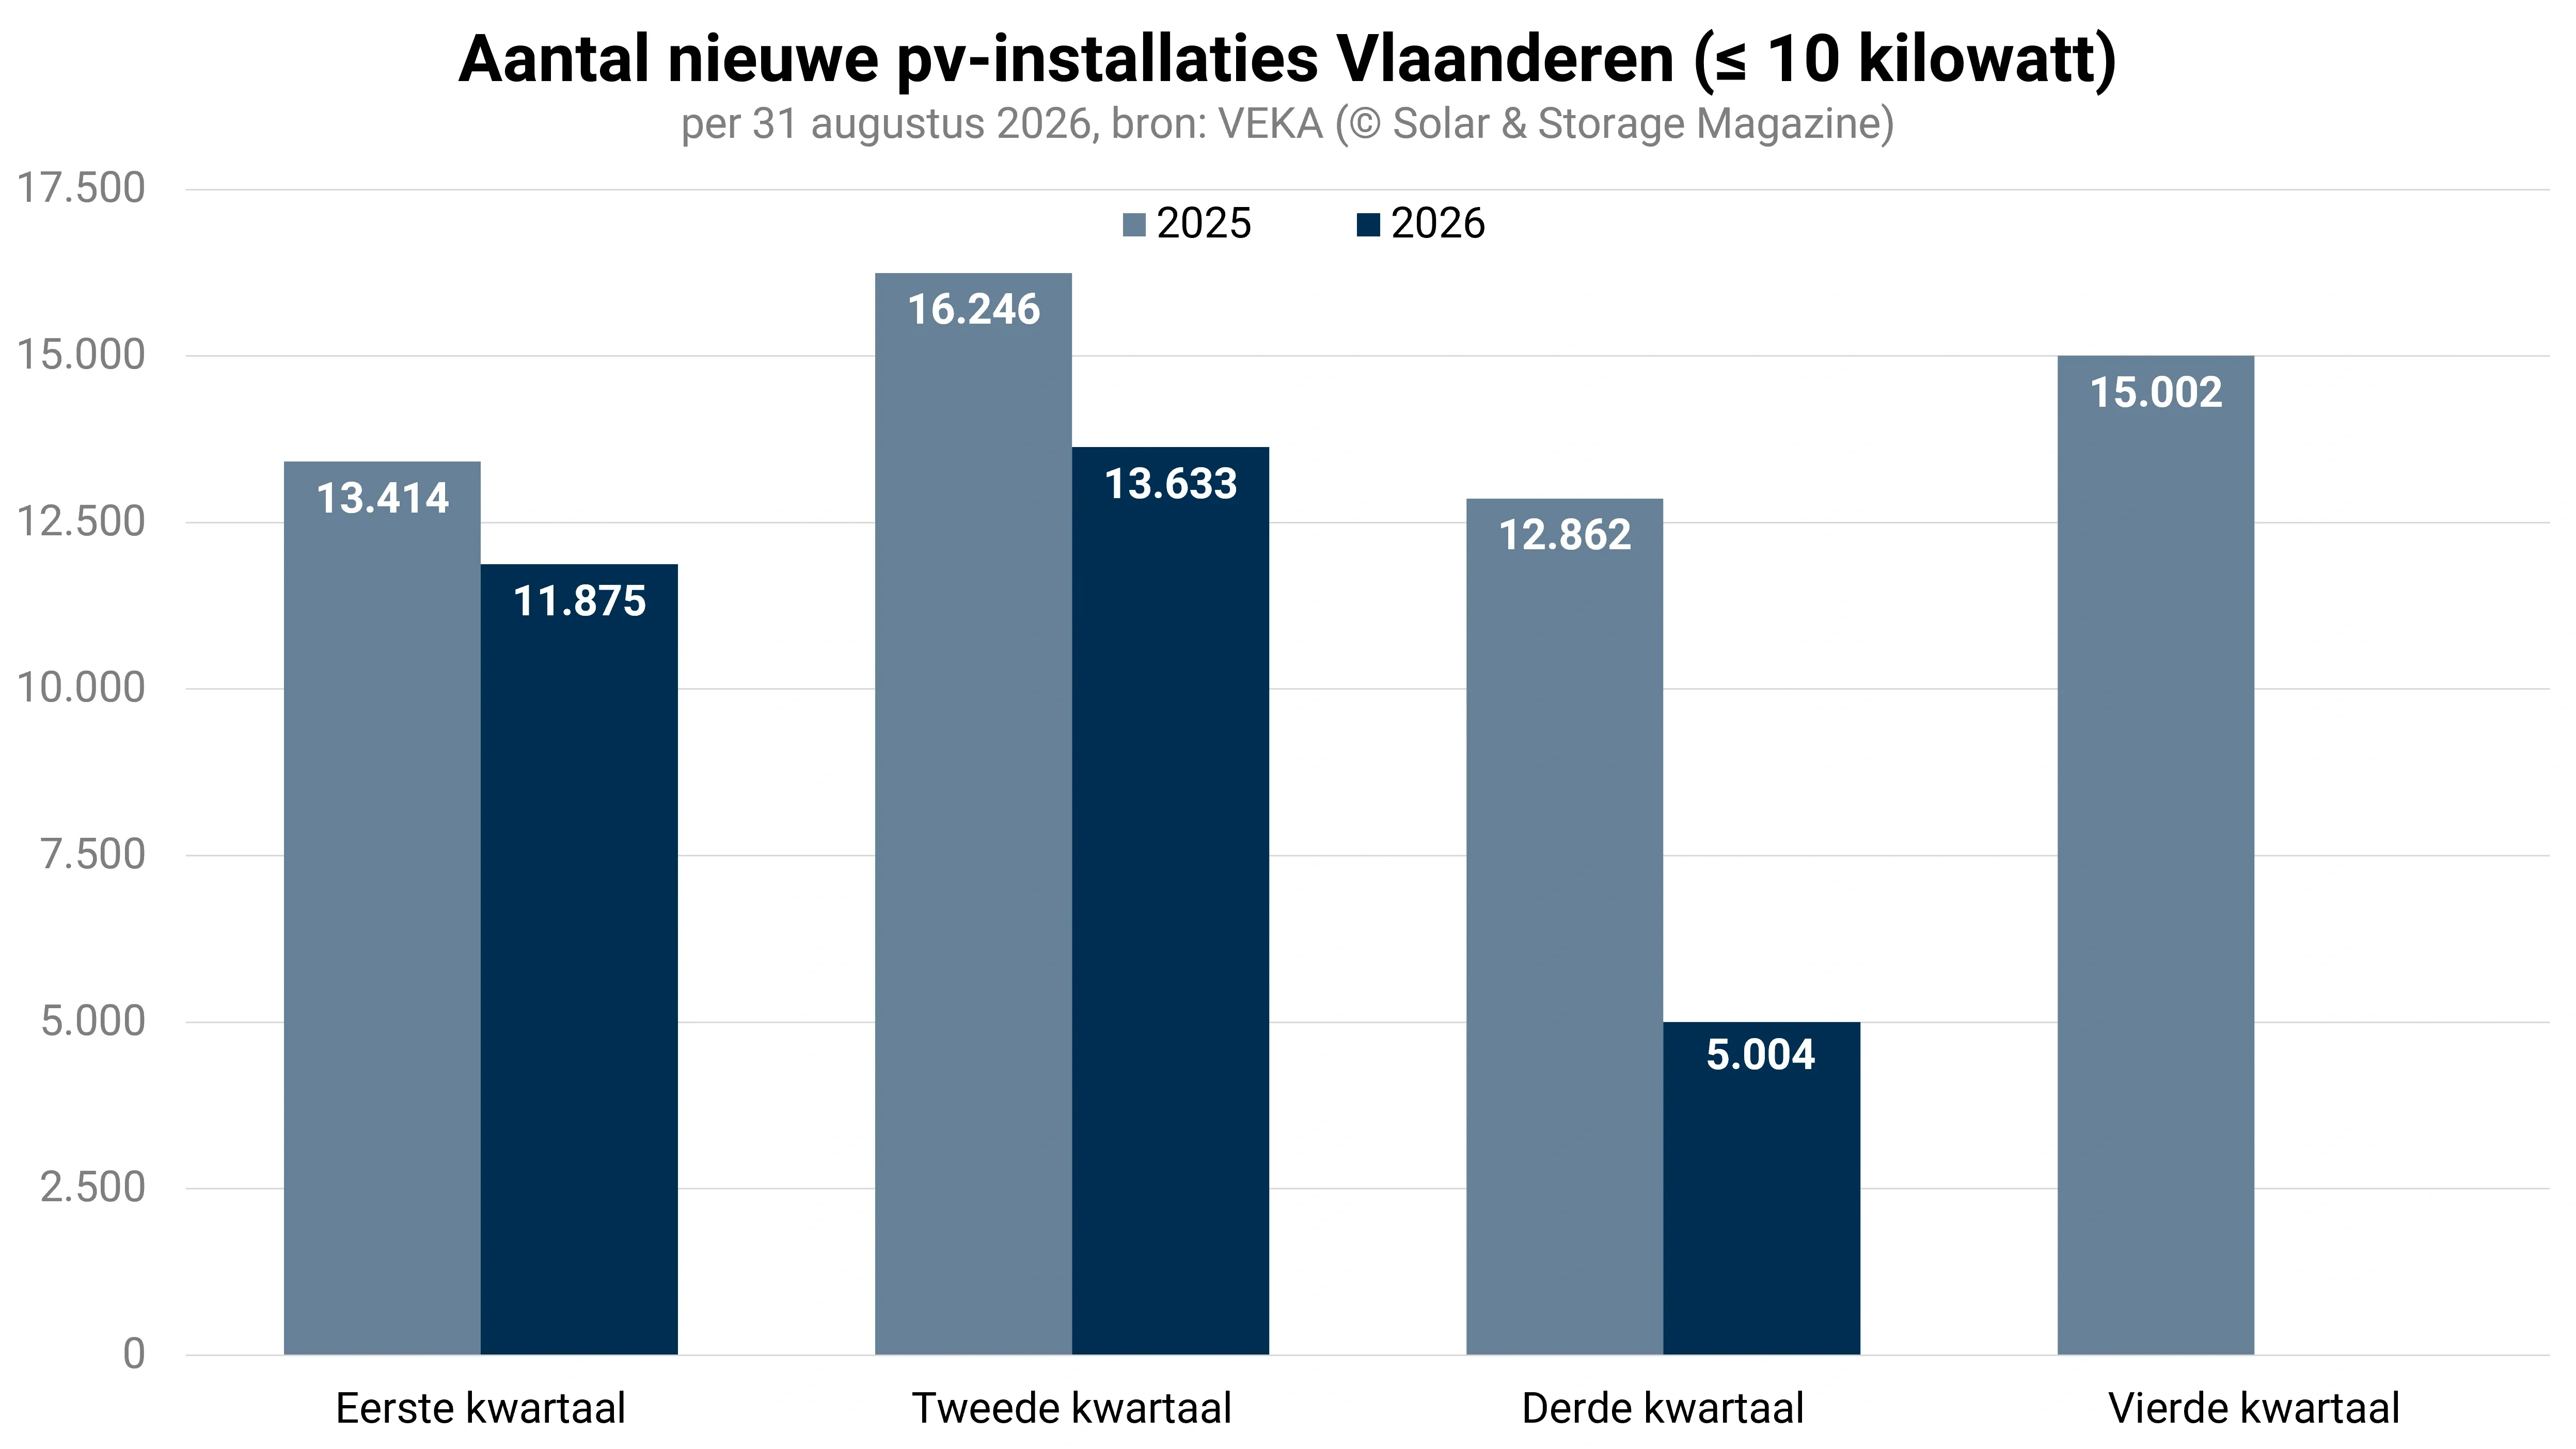
The first quarter recorded a monthly average of 3,958 newly registered PV systems up to 10 kilowatts, equivalent to an average of 18.43 megawatts of inverter capacity per month. The second quarter was even higher: an average of 4,544 PV systems per month and 21.98 megawatts – an increase compared to the first quarter, reflecting a healthy trend in the first half of the year. For August, there are currently only 1,657 registrations on record, compared to 3,447 in the same month of 2025. This contrast is largely explained by the delay in reporting new installations to VEKA.
By power category
The table below provides an overview of the solar panel systems registered by VEKA between January and August 2026, where the stated capacities refer to the AC capacity of the inverter.
By province
The overview below shows how the number of new installations in the period from January to August 2026 compares across the provinces.
Per calendar month
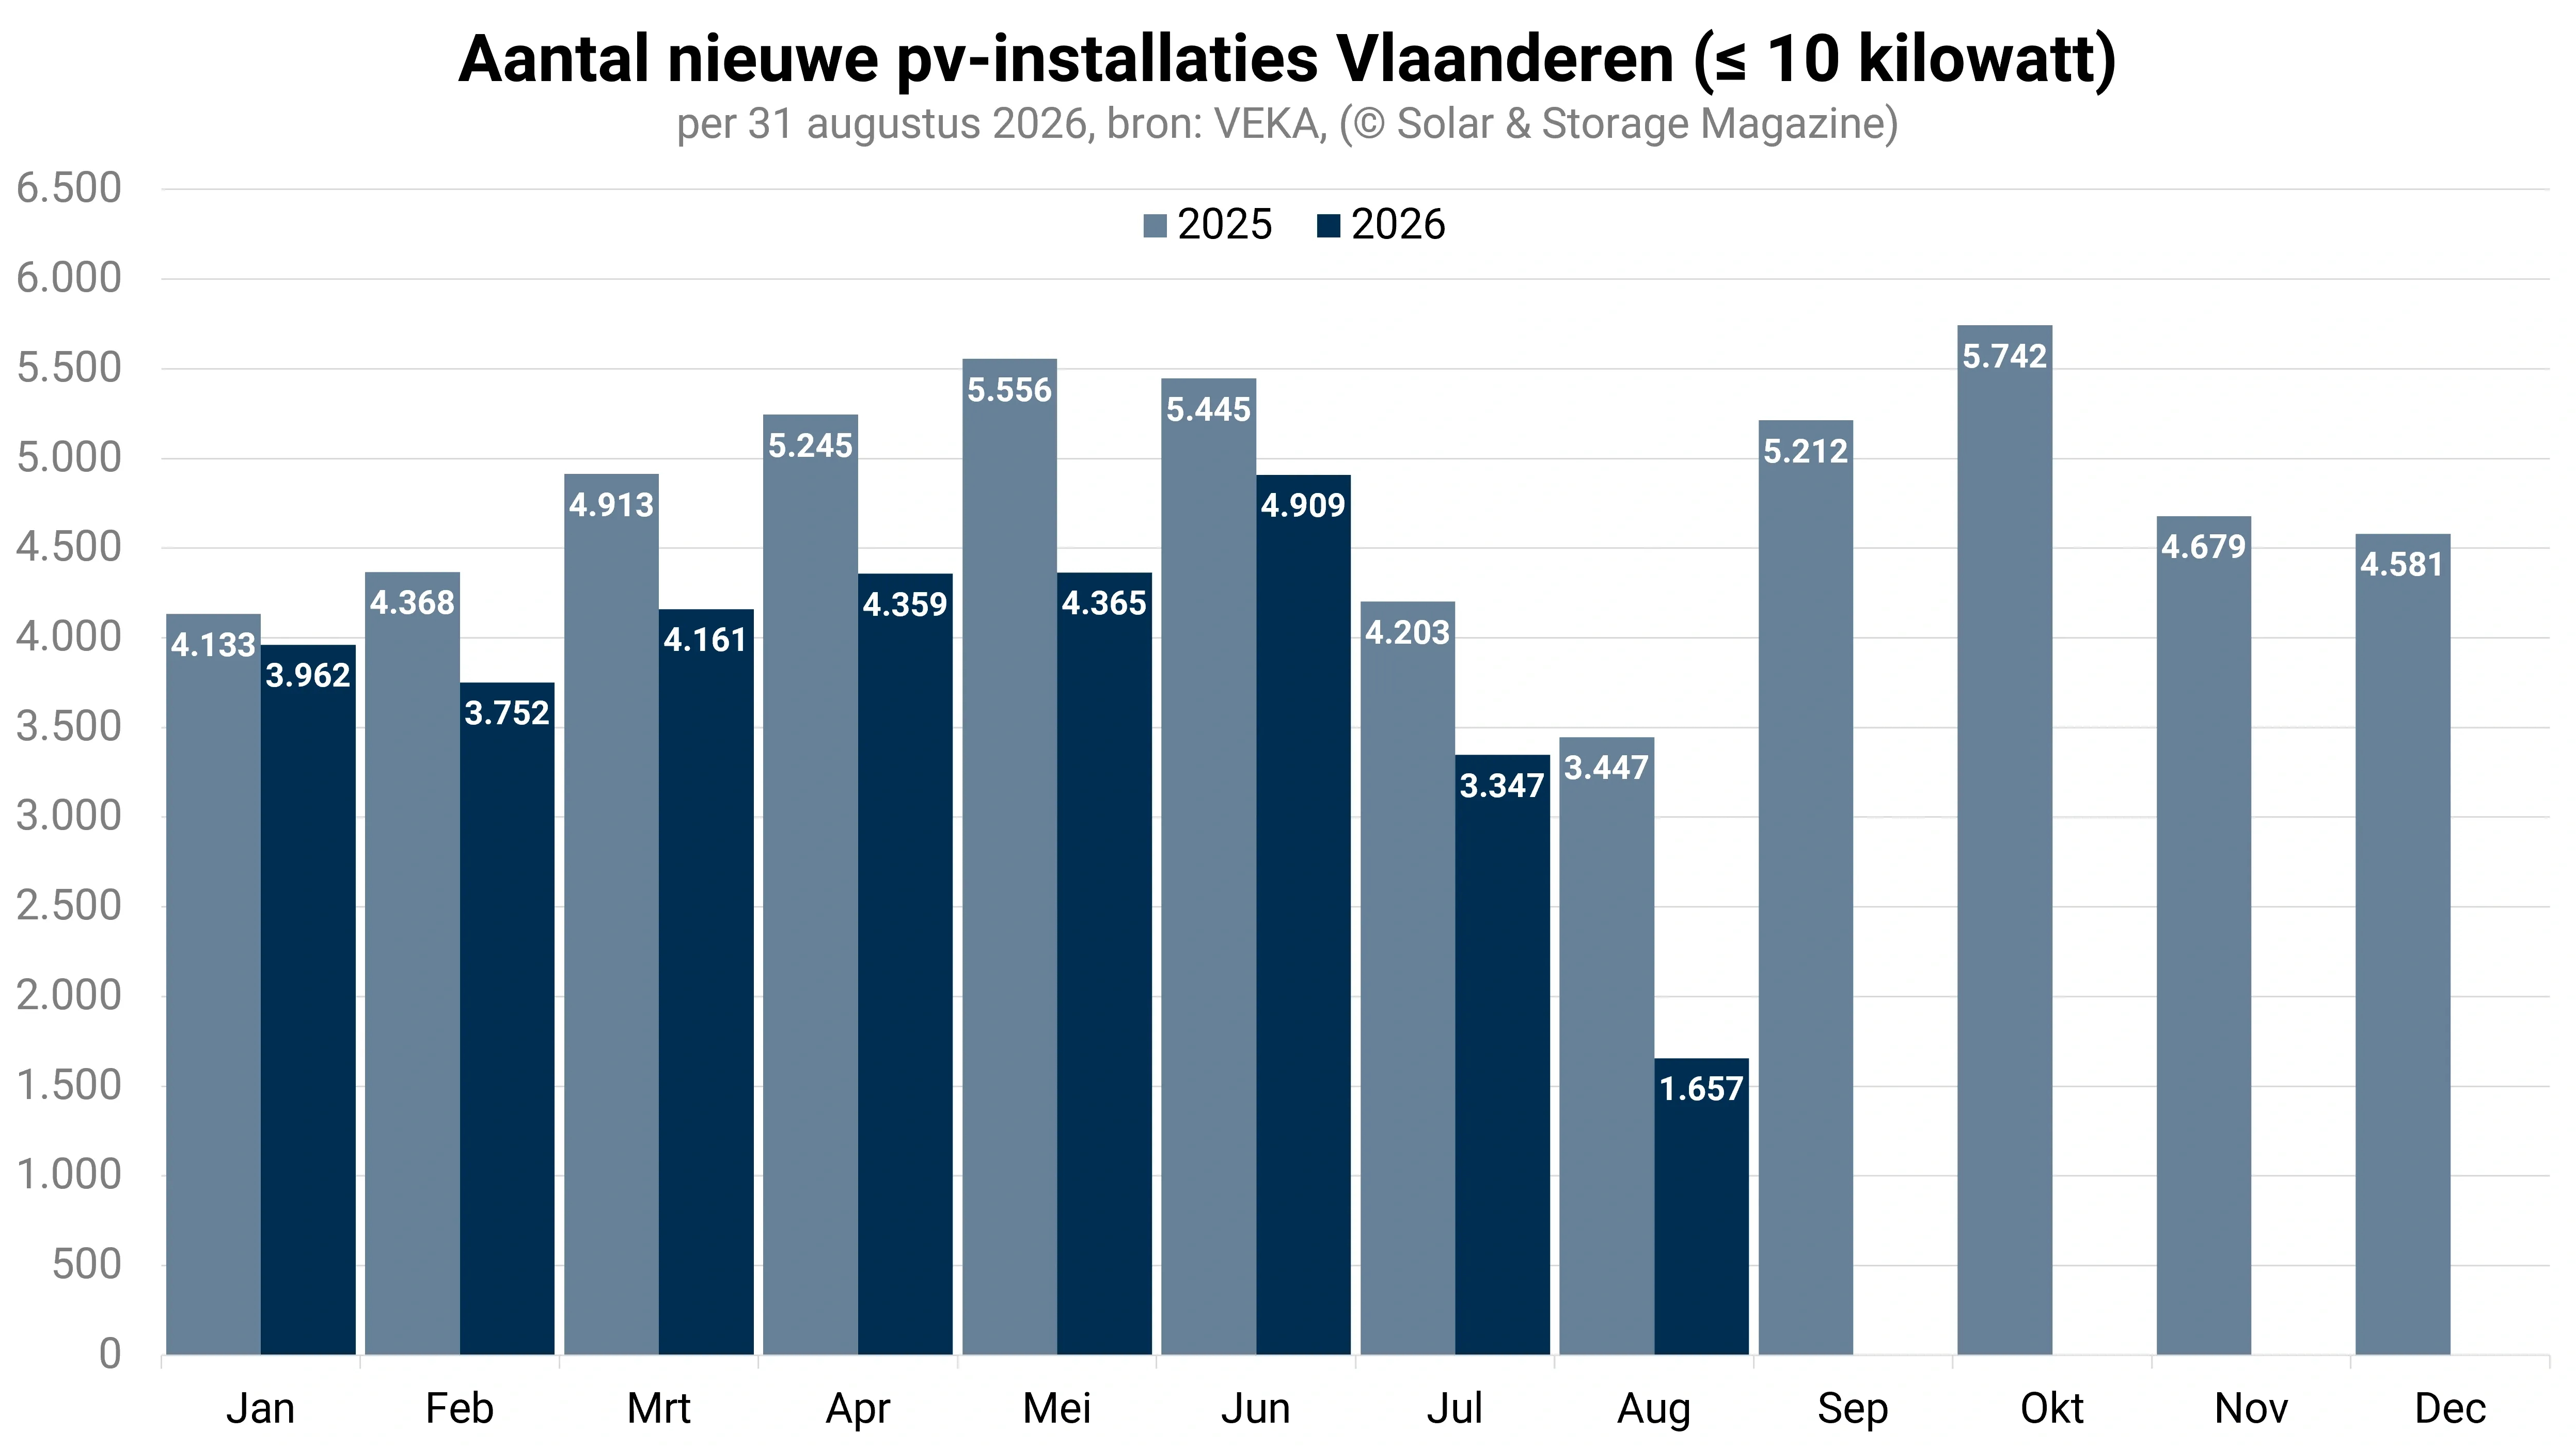
The two graphs below compare the first months of 2025 and 2026, both in terms of the number of new installations under 10 kilowatts and the associated inverter capacity. The data for May and June already provide a solid picture for 2026. A steady growth is visible in the first half of the calendar year. The data for July and August are still provisional and will be revised upwards in the coming months.
Commercial market
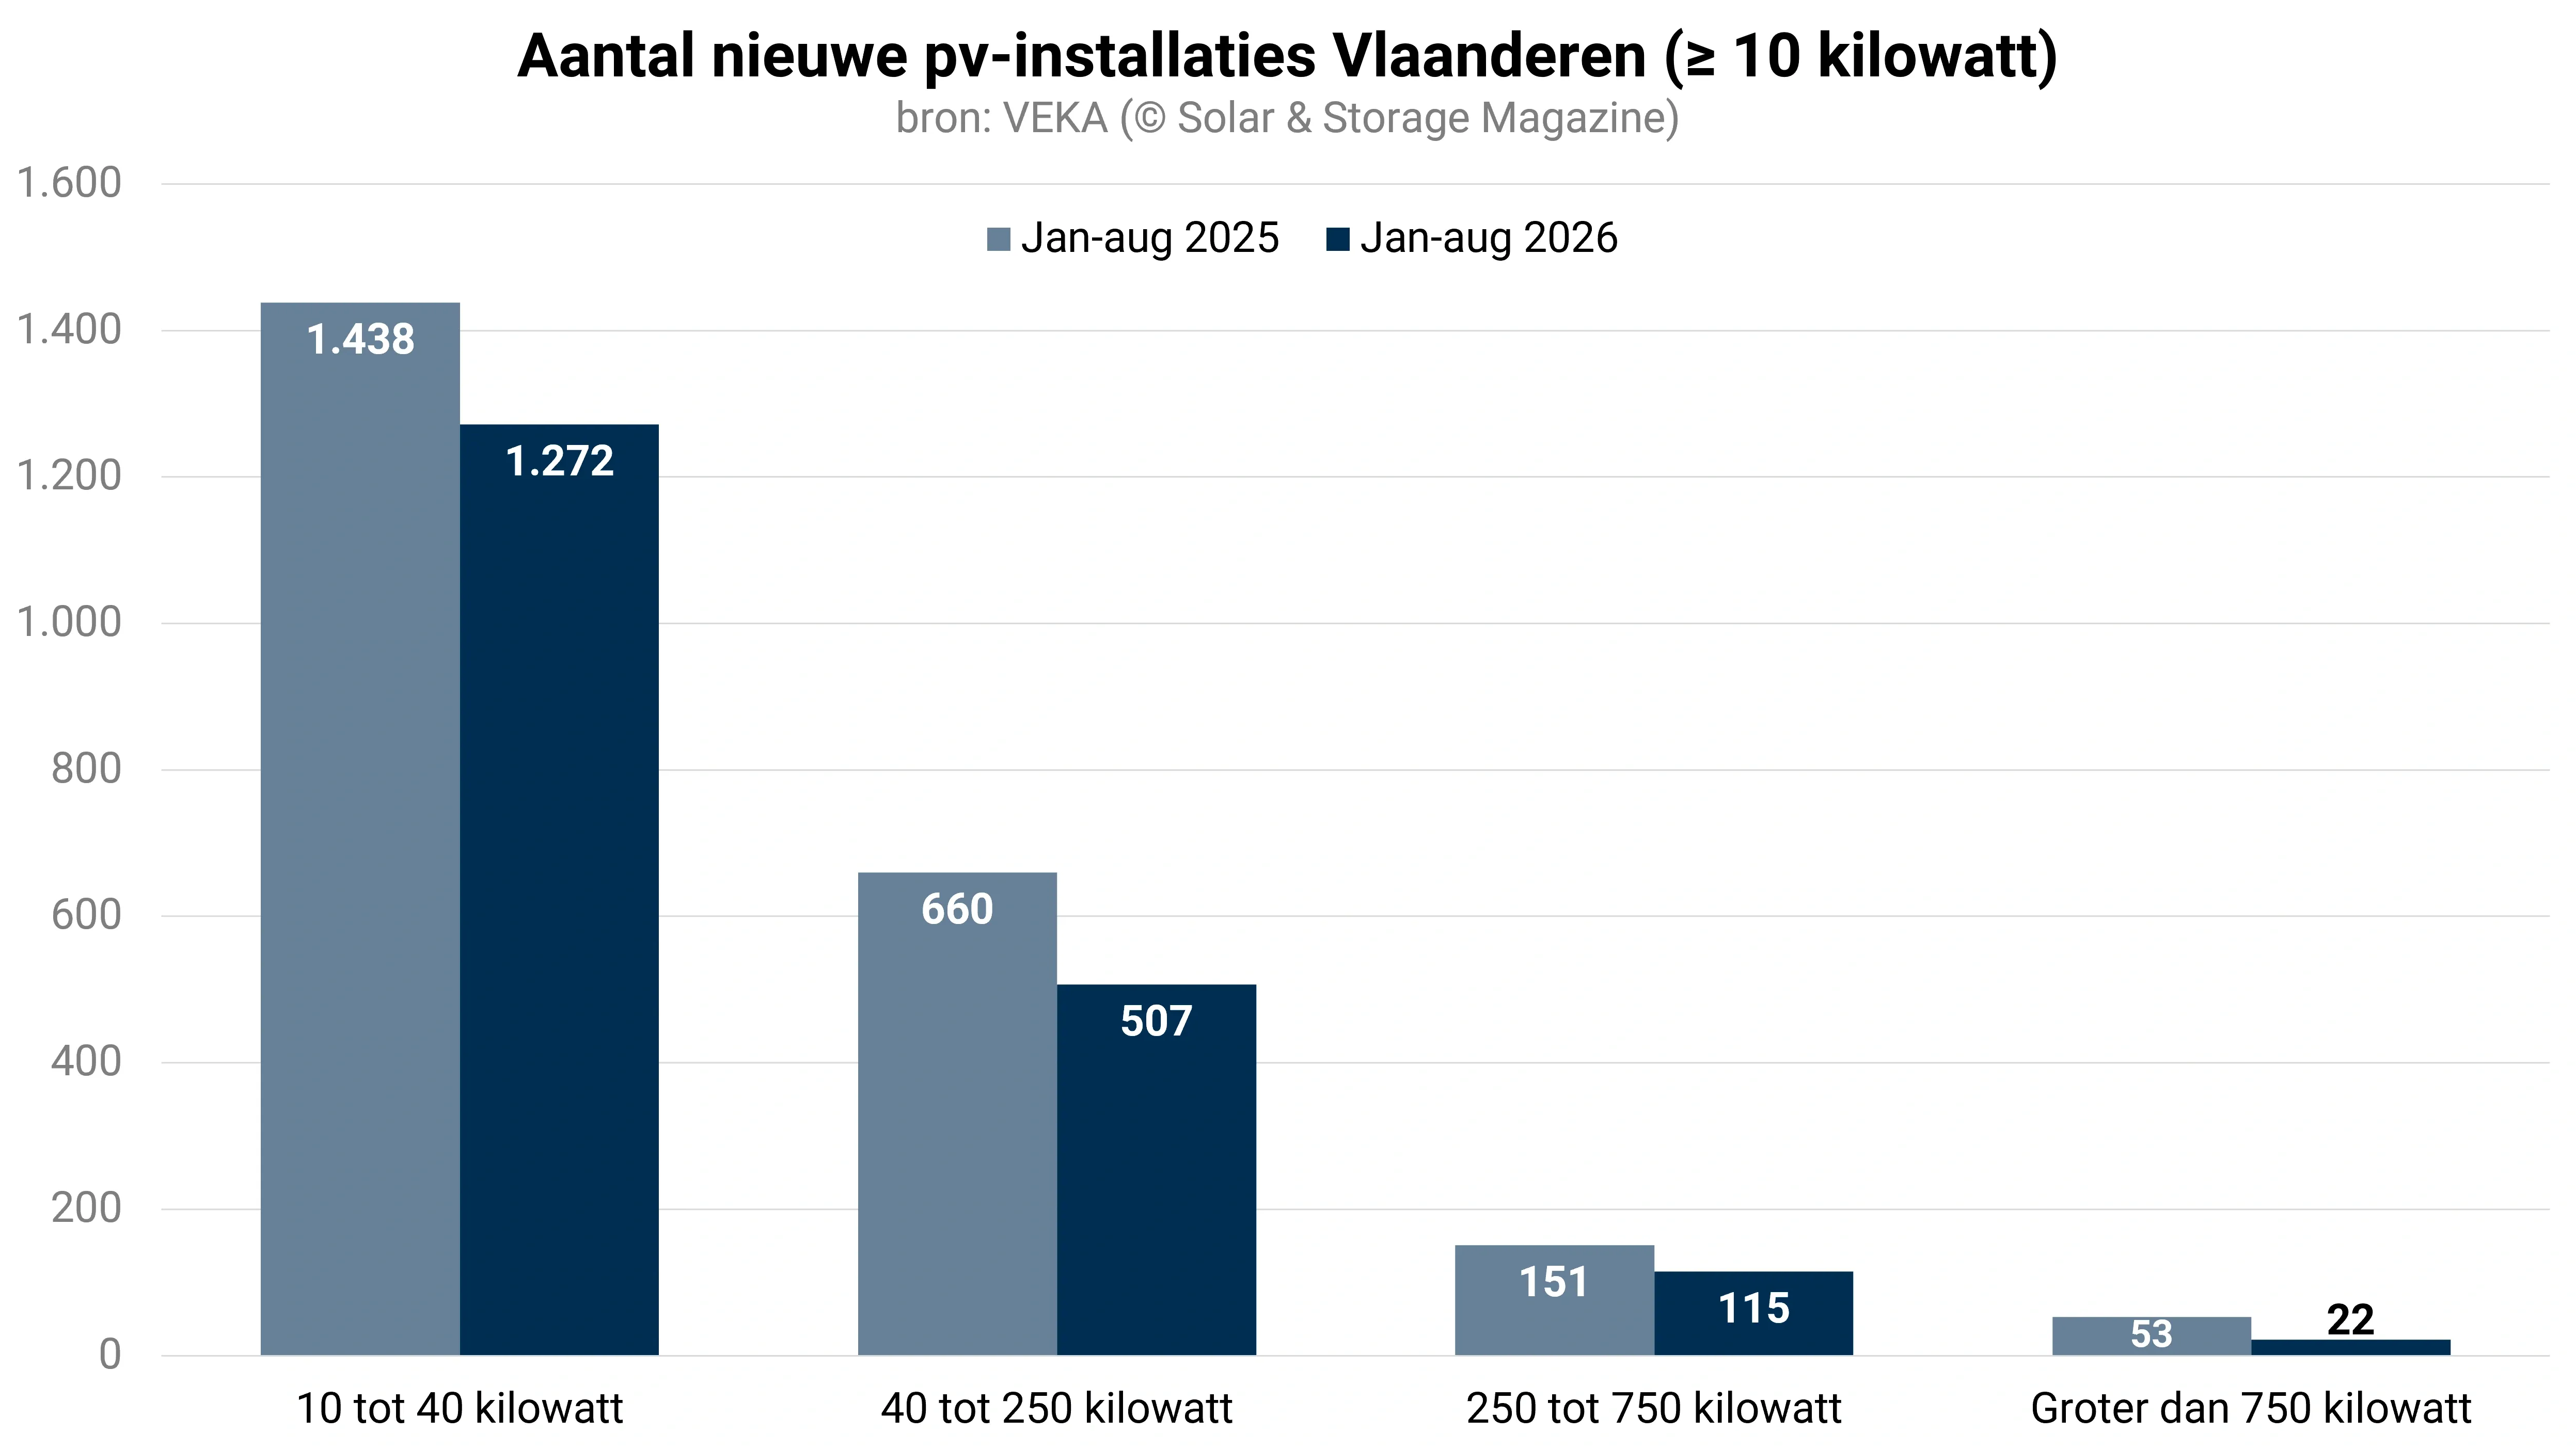
For the commercial market with systems exceeding 10 kilowatts, the two charts below illustrate the relationship between the number of new installations and the associated inverter capacity in the first eight months of 2025 and 2026. The preliminary figures indicate declines across all categories; however, registration lag is most pronounced in this segment. Commercial solar panel installations often only appear in VEKA statistics after several months, and in the case of large-scale projects, sometimes significantly later. Consequently, the final 2026 figures for this segment are expected to be substantially higher than what the current data suggests.
Number of installations
The table below compares the figures for 2025 and 2026. The difference currently stands at 18 percent, but this figure is significantly distorted by the incomplete registration of the most recent months. The first six months of 2026, for which the data are more reliable, show a decline of approximately 14 percent in the residential category. In the coming period, a considerable number of installations from 2026 are expected to be added to the registration.
Average installation size
The table below compares the capacity of new installations between 2025 and 2026, showing a preliminary decline of 31 percent. It is important to note that this figure is largely driven by the highly preliminary data for the most recent months and by the drop in megaprojects exceeding 750 kilowatts – the segment with the longest registration lag at VEKA. The average installation size for the first eight months of this calendar year stands at 9.48 kilowatts, compared to 11.22 kilowatts in the same period of 2025.
Top 5
The two charts below illustrate both the number of installations completed and the total inverter capacity per year. In terms of capacity, 2025 has secured a definitive place in the top 5, with its final figure, now adjusted to 695.5 megawatts, ranking fifth. In terms of the number of new installations (60,939), 2025 narrowly missed the top 5: the fifth position is held by 2024, with 80,846 systems. For 2026, a top 5 ranking in both categories remains far off at the current registration rate.
More than 1.1 million solar panel installations
Flanders, which crossed the 8-gigawatt milestone this spring, had 8,155.1 megawatts of inverter capacity spread across 1,118,127 solar panel installations as of August 31.
Frequently asked questions
How did the preliminary data for July 2026 solar panel registrations in Flanders change in the latest VEKA update?
The recorded installations for July 2026 more than doubled from 1,648 to 3,347 in the latest data. This significant upward correction highlights that recent monthly figures are provisional and subject to revision.
What was the average monthly inverter capacity for newly registered PV systems up to 10 kilowatts in Flanders during the second quarter?
The second quarter averaged 21.98 megawatts of inverter capacity per month for systems up to 10 kilowatts. This represented an increase from the first quarter, reflecting a healthy trend in residential solar adoption.
What is the total installed solar capacity and number of installations in Flanders as of August 31, 2026?
Flanders had 8,155.1 megawatts of inverter capacity spread across 1,118,127 solar panel installations as of August 31. The region crossed the 8-gigawatt milestone this spring, marking a significant expansion in renewable energy infrastructure.