Italy's Solar Power: Nearly 2.1 Million Installations, GSE Data

Navigation
The GSE’s 2025 report records 43.7 GW of installed capacity and generation exceeding 45 TWh. Small-scale systems account for 85% of the total; monthly reports will be issued starting in November.
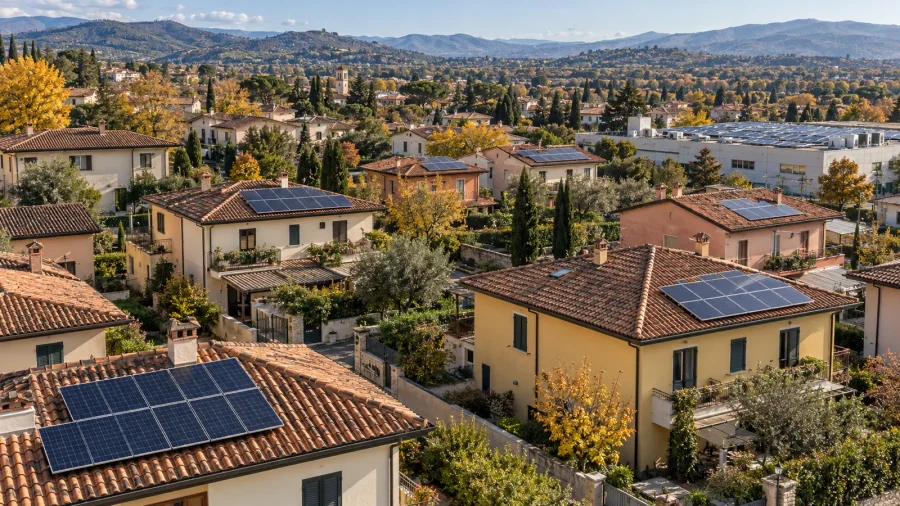
Italy’s photovoltaic sector has crossed another milestone in its expansion: by the end of 2025, there were just under 2.1 million operational installations, with a total capacity of 43.7 gigawatts, an 18% increase compared to 2024. These are the figures from the new Statistical Report on Solar Photovoltaics, announced by the GSE on October 29.
The data reflects two trends: the widespread presence of small-scale installations, including those on residential rooftops, and the growing share of large-scale installations. Energy production has also increased, while the GSE has announced that monthly updates on the sector will begin in November.
Small-scale installations account for 85% of the total
The segment below 10 kW accounts for 85% of the installations in Italy. However, its share of total capacity remains around 20%. This distinction is crucial for interpreting the data correctly: a large number of small-scale installations can be distributed across numerous buildings without concentrating the majority of the installed megawatts.
At the opposite extreme, installations above 10 MW represent 12% of the national capacity. This category recorded the most significant growth compared to 2024, at 49%. The transition is therefore progressing both through widespread installations and through projects that individually carry a much greater weight on productive capacity.
The number of installations, capacity, and generation describe different aspects. A kilowatt (kW) indicates power; a kilowatt-hour (kWh) measures a quantity of energy. For those designing an installation on their own building, this distinction is the first step in reading a quote and comparing it with actual consumption.
Lombardy leads in installed capacity, followed by Lazio, Puglia, and Emilia-Romagna
Lombardy accounts for 13% of Italy's total photovoltaic capacity. Lazio, Puglia, and Emilia-Romagna follow, each holding a share exceeding 9%. The regional landscape indicates that the sector does not develop exclusively in the sunniest areas; the total installed capacity also depends on the widespread adoption of installations and their individual scale.
However, a ranking based on total installed capacity does not equate to a ranking of the yield from a single rooftop. Such an assessment requires consideration of solar exposure, tilt angle, shading, and specific system characteristics. Regional totals are useful for understanding market penetration, but designing a system for a specific building requires a tailored evaluation.
The residential sector accounts for 22% of the installed capacity
According to the summary published by the GSE, 49% of the total capacity is associated with the industrial sector, including the energy sector. The residential sector accounts for 22%, and the tertiary sector for 21%.
Do you have an issue related to this topic?
Describe your case: we will help you submit your request to professionals and companies in the sector.
These percentages refer to the distribution of photovoltaic power across end-use sectors. They do not indicate the percentage of households that own a system, nor the share of domestic electricity automatically covered by solar power. To interpret them correctly, it is essential to maintain the reference to the measured quantity.
For homes and businesses, the practical issue remains the relationship between production and consumption. A system can generate energy when the building’s demand is low, while part of the demand may be concentrated during hours without sunlight. This underscores the importance of assessing the consumption profile before selecting the system’s power and any potential photovoltaic storage solution.
Production exceeded 45 TWh: a 25% increase compared to 2024
In 2025, photovoltaic generation exceeded 45 terawatt-hours, a 25% increase over the previous year. The GSE attributes 34% of renewable energy generation and over 16% of total national electricity production to the sector.
This involves two comparisons with different denominators: the first considers only electricity generated from renewables, while the second covers all national production. These figures should not be confused with the coverage of the country’s entire energy demand, which also includes non-electric consumption.
The increase in generation outpaces the growth in installed capacity, but the year-on-year comparison does not solely reflect an improvement in panel efficiency. These two aggregated data points describe the national fleet and the energy generated during the period; they do not allow for the derivation of a yield or savings promise for each new installation.
Starting from November, the GSE will begin publishing monthly reports.
The operator announces another informational update: starting in November, it will publish monthly reports on photovoltaics, including data on the installed base broken down by region, size class, and sector. Updates are expected approximately four to six weeks after the end of the observation period.
This new frequency will allow businesses, designers, and operators to more closely track the evolution of installations, complementing the annual report. For owners evaluating an investment, the practical message remains: a growing market provides a context, while the viability of any specific solution must be built on the building's energy consumption and the project's characteristics.
Sources and references
Request information for Photovoltaics
Need clarification or a quote? Submit a request; it will be handled by the editorial team.
Author: Online Editorial Team
Solar Power in Italy: Nearly 2.1 Million Installations, GSE Data
2026 Photovoltaic Bonus: 50% or 36% Tax Deduction, Requirements and Expenses
Thermal Account 3.0 in 2026: incentives, requirements, and GSE application
2026 Window and Door Bonus: Tax Deductions, Requirements, and Documentation
2026 Bathroom Bonus: When Renovations Are Tax-Deductible
Air Conditioner Bonus 2026: Tax Deductions, Requirements, and ENEA
2026 Boiler Bonus: Eligible Incentives and New Exclusions
Superbonus 2025: The guide to eligible works and how to access the tax deduction
Salva Casa Decree: what it provides, what can be regularized, and how it works
2026 First Home Incentives: Requirements, Taxes, Residency, and Lapse
2026 Single Allowance: Amounts, ISEE, Requirements, and Application
Categories
Discover the products
Vitocal 250-A Hybrid: monobloc heat pump for hybrid systems
MARITIME CONTAINERS
Internal tent with manual guides
Fotovoltaic in Italy: nearly 2.1 million installations, GSE data
Fotovoltaico in Italia: quasi 2,1 milioni di impianti, i dati del GSE
Edilizia.com among your sources!
Want to find Edilizia.com more easily on Google?
Add Edilizia.com to your preferred sources to make it simpler to retrieve guides, regulations, court rulings, and updates when searching on Google.
It is free and helps you find us faster in search results.
Frequently asked questions
What was the total installed solar capacity in Italy by the end of 2025 according to the GSE report?
Italy reached 43.7 gigawatts of installed solar capacity by the end of 2025. This figure represents an 18% increase compared to the previous year, marking a significant milestone in the sector's expansion.
How do small-scale solar installations under 10 kW compare to large-scale systems in terms of total capacity share?
Small-scale systems account for 85% of all installations but only about 20% of total capacity. This disparity highlights that while small systems are numerous, large-scale projects contribute disproportionately to the overall energy generation.
What change did the GSE announce regarding the frequency of solar sector data updates starting in November?
The GSE announced that monthly updates on the solar sector will begin in November. This shift from annual to monthly reporting will provide developers and investors with more frequent data to track market trends and performance.